
Learning Objectives
Following this assignment students should be able to:
- execute simple math in the R console
- assign and manipulate variables
- use built-in functions for math and stats
- understand the assignment and execute flow of an R script
- understand the vector and data frame object structures
- assign, subset, and manipulate data in a vector
- execute vector algebra
- import data frames and interact with columns as vectors
Reading
-
Topics
- R & RStudio
- Expressions & Variables
- Types
- Errors
- Vectors & Data Frames
- Importing Data
- Readable Code
-
Readings
- Getting Started
- Introduction to R
- Starting with data
- Vector Reference (Read links at bottom)
- Data Frame Reference
Exercises
-- Basic Expressions --
Think about what value each of the following expressions will return? Check your answers using the R Console by typing each expression into the console on the line marked
>and pressing enter.- 2 - 10
- 3 * 5
- 9 / 2
- 5 - 3 * 2
- (5 - 3) * 2
- 4 ** 2
- 8 / 2 ** 2
Did any of the results surprise you? If so, then might have run in to some order of operations confusion. The order of operators in R are listed HERE.
Now turn this set of expressions into a program that you can save by using an R script. For each expression add one line to the script as part of a print statement. Copy and paste the script into the console to display the answer to the screen. If you are using RStudio, you can use Ctrl+Enter (Windows & Linux) or Command+Enter (Mac) to run the line or selection of code directly from your script.
To tell someone reading the code what this section of the code is about, add a comment line that says ‘Problem 1’ before the code that answers the problem. Comments in R are added by adding the
#sign. Anything after a#sign on the same line is ignored when the program is run. So, the start of your program should look something like:[click here for output]# Problem 1 print(2-10)-- Basic Variables --
Here is a small program that converts a mass in kilograms to a mass in grams and then prints out the resulting value.
mass_kg <- 2.62
mass_g <- mass_kg * 1000
print(mass_g)
Modify this code to create a variable that stores a mass in pounds and assign it a value of 56 (the weight of a bushel of corn). Convert this value to kilograms (we are serious scientists after all). There are approximately 2.2046 lbs in a kilogram, so divide the variable storing the weight in pounds by 2.2046 and store this value in a new variable for storing mass in kilograms. Print the value of the new variable to the screen.
[click here for output]-- More Variables --
Calculate a total weight in pounds of 20 bushels of soybeans and then convert it to kilograms. The total weight is simply the sum of the weight of all 20 bushels, but in this case we know that the weight of one bushel of soybeans is 60 pounds.
- Add a new section to your R script starting with a comment.
- Create a variable
busheland assign it the mass of a single bushel. - Create a variable
bushelsand assign it the number of bushels. - Create a variable
bushel_totand assign it a value by multiplying the two variables together. - Convert the value of
bushel_totinto kilograms and assign this value to a new variable. - Print the final answer to the screen.
Think about the choice of variable names. If we came back to the code for this assignment in two weeks (without the assignment itself in hand) would we be able to remember what these variables were referring to and therefore what was going on in the code? The variable name
bushelis also kind of long. If we had to type it many times it would be faster just to typeb. We could also use really descriptive alternatives likebushel_weight_in_pounds. Or we would compromise and abbreviate this or leave out some of the words to make it shorter (e.g.,bshl_lbs).Think about appropriate variable names and then rename the variables in your program to what you find most useful.
[click here for output]-- Built-in Functions --
Use the built-in functions
abs(),round(),sqrt(). A built-in function is one that you don’t need to install and load a package to use. Use another function,help(), to learn how to use any of the functions that you don’t know how to use appropriately.help()takes one parameter, the name of the function you want information about. E.g.,help(round).- The absolute value of -48.
- 5.26485 rounded to one decimal place. The function
round()takes two arguments, the number to be rounded and the number of decimal places. - 6.2 rounded to the nearest integer. You don’t have to specify the number of
decimal places in this case if you don’t want to, because
round()will default to using 0 if the second argument is not provided. Look athelp(round)or?roundto see how this is indicated. - Assign the value of the square root of 486 to a variable. Then round the variable you’ve created to 2 decimal places and assign it to another variable. Print out the rounded value.
- Do the same thing as in problem 4, but instead of creating the intermediate
variable, perform both the square root and the round on a single line by
putting the
sqrt()call inside theround()call.
-- Built-in Functions --
Use the built-in character functions
tolowerandtoupperto manipulate and print the following string."species"in all capital letters"SPECIES"in all lower case letters
There are other built-in character functions in R, but they are surprisingly clunky and difficult to use. Lucky for us, someone else thought so too and built a package called
[click here for output]stringr, that we introduce next.-- Modify the Code 1 --
The following code uses crop production and planted area data from FAOSTAT to calculate national rice yields (tonnes per hectare) for Australia in the years 1990 and 2011 and converts the yields to bushels per acre.
aus_rice_prod_1990 <- 924000
aus_rice_prod_2011 <- 723283
aus_rice_area_1990 <- 105000
aus_rice_area_2011 <- 75783
bu_per_T <- 36.47
ac_per_ha <- 2.47
aus_rice_1990_bu_ac <- (aus_rice_prod_1990 / aus_rice_area_1990 * bu_per_T / ac_per_ha)
aus_rice_2011_bu_ac <- (aus_rice_prod_2011 / aus_rice_area_2011 * bu_per_T / ac_per_ha)
Modify the code to produce the following items and print them out in order:
- The sum of rice production for the two years combined.
- The difference between the total bushels per acre for the two years. We only want an absolute difference, so use abs() function to make sure the number is positive.
- The average of the two years’ yield in bushels per acre.
-- Code Shuffle --
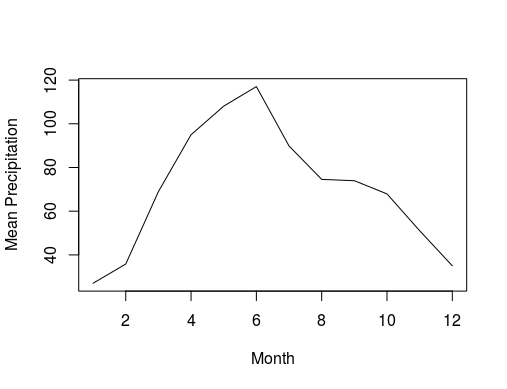
We are interested in understanding the monthly variation in precipitation in Stillwater, OK. We’ll use some data downloaded from the Oklahoma Mesonet.
Start by creating a
datadirectory in the same directory as your homework scripts and then downloading the data and saving it to thisdatadirectory.Each row of this data file is a year (from 1994 to 2016) and each column is a month (January - December).
Rearrange the following program so that it:
- Imports the data
- Calculates the average precipitation in each month across years
- Plots the monthly averages as a simple line plot
Finally, add a comment above the code that describes what it does. The comment character in R is
#.plot(monthly_mean_ppt, type = "l", xlab = "Month", ylab = "Mean Precipitation") monthly_mean_ppt <- colMeans(ppt_data) ppt_data <- read.csv("./data/stillwater_precip.csv", header = FALSE)It’s OK if you don’t know exactly how the details of the program work at this point, you just need to figure out the right order based on when variables are defined and when they are used.
[click here for output]-- NDVI --
The Normalized Difference Vegetation Index (NDVI) has been measured by your field crew on fields across the wheat belt in Oklahoma. The NDVI values have been entered into the following vector in order of sampling and fields are numbered starting at one. Cut and paste the list into your assignment and then answer the following questions by printing them to the screen. Some R functions that may come in handy include
length(),max(),min(),mean(),head(), andtail().ndvi <- c(0.58, 0.85, 0.73, 0.88, 0.89, 0.66, 0.81, 0.87, 0.74, 0.8, 0.65, 0.64, 0.88, 0.63, 0.54, 0.67, 0.53, 0.82, 0.8, 0.62, 0.78, 0.56, 0.57, 0.8, 0.56, 0.53, 0.54, 0.83, 0.57, 0.79, 0.61, 0.58, 0.85, 0.85, 0.82, 0.83, 0.65, 0.71, 0.74, 0.81, 0.75, 0.88, 0.65, 0.73, 0.63, 0.67, 0.73, 0.53, 0.68, 0.84, 0.67, 0.67, 0.64, 0.55, 0.61, 0.8, 0.61, 0.83, 0.6, 0.89, 0.64, 0.63, 0.67, 0.58, 0.56, 0.54, 0.79, 0.5, 0.55, 0.72, 0.69, 0.64, 0.82, 0.58, 0.59, 0.88, 0.78, 0.52, 0.7, 0.84, 0.61, 0.87, 0.5, 0.6, 0.66, 0.87, 0.52, 0.66, 0.82, 0.8, 0.65, 0.51, 0.84, 0.63, 0.87, 0.79)- How many fields were measured?
- What was NDVI at field 37?
- What was NDVI at the last field? Have the computer choose the last field automatically in some way, not by manually entering its position.
- What is the lowest NDVI measured?
- What is the highest NDVI measured?
- What is the average NDVI measured across all fields?
-- Specific Leaf Area 1 --
You have data on the leaf mass and area for wheat samples stored in the following vectors:
leaf_mass <- c(1.62, 2.34, 1.84, 1.78, 3.89, 2.57, 1.74, 1.53, 3.42, 2.58)
leaf_area <- c(428, 547, 499, 253, 513, 325, 296, 468, 575, 468)
Copy these vectors into an R script and then determine the following:
- The specific leaf area (SLA) of each leaf (i.e. the area divided by mass)
- The total leaf mass of all samples
- A vector of the SLA of samples with leaf mass less than 3
-- Specific Leaf Area 2 --
This is a follow up to Specific Leaf Area 1.
One of your fellow students has posted a comma-delimited text file online for you to analyze. The file contains measurements from a series of wheat leaf samples (sample_id, leaf mass, and leaf area) and they need you to determine the specific leaf area (
area / mass). You could do this using a spreadsheet, but the project that you are working on is going to be generating lots of these files so you decide to write a program to automate the process.Download the data, use
read.csv()to import it into R, and then use the$operator to print out:- The leaf area for each sample
- The SLA for each of the samples