Data Science for Agriculture
How to manage and manipulate data for agricultural research

Your advisor has tasked you with analyzing weather data from the Oklahoma Mesonet for an upcoming presentation. In particular, he is interested in the connection between weather and elevation. Since he knows you’ve been learning awesome data visualization and analysis tools in your scientific computing course he asks you to produce a map that shows the locations of all active Oklahoma Mesonet stations as well as the elevation, climate zones and county boundaries.
Using install.packages(), install the raster, rgdal, and sp packages.
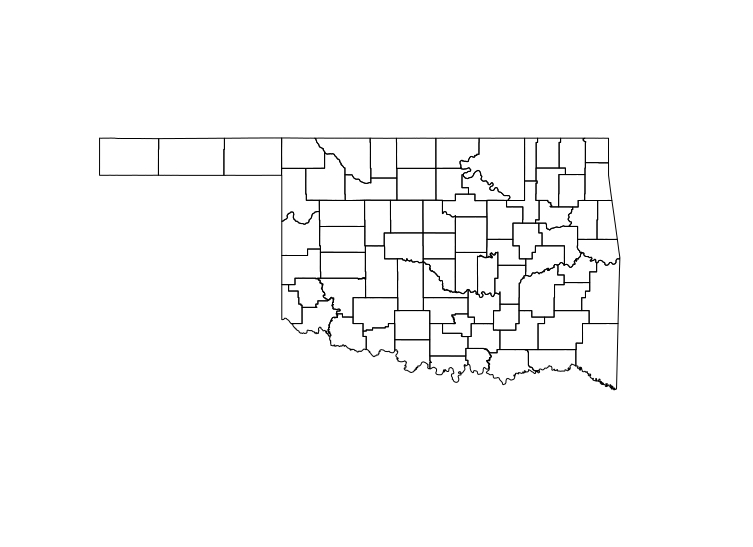
You decide to start with a shapefile of the county boundaries. Download the
Oklahoma county boundaries shapefile from
here and the projection file from
here. Unzip both files into
your data directory. Use the readOGR function to read the county layer into
R. Plot it using the plot function.
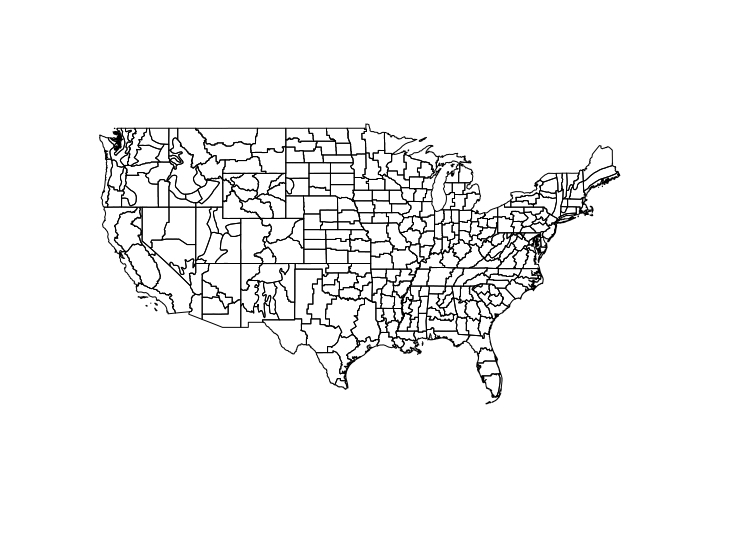
Next you decide to read in a layer of the climate division boundaries.
Download the zipfile of NOAA climate divisions from
here
and extract it in your data directory. Read in the
GIS.OFFICIAL_CLIM_DIVISIONS layer and plot it using the plot function.
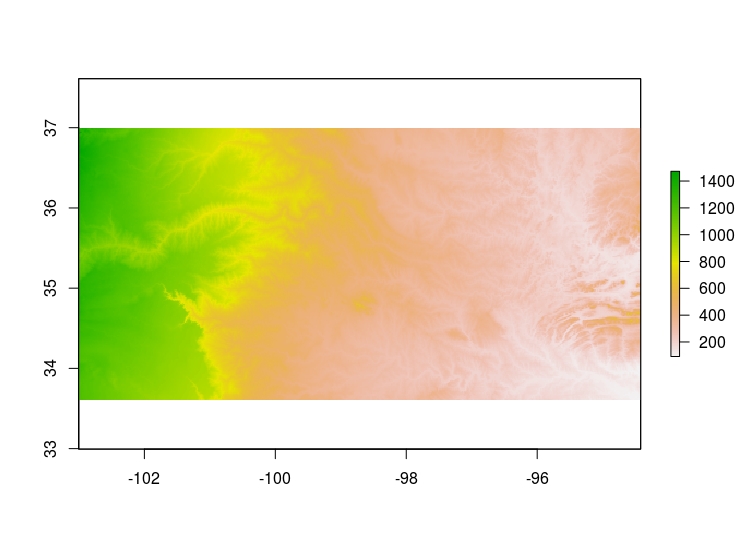
Now that you’ve got the vector data layers imported, you decide to import a raster file of elevation for Oklahoma. Your friend has already clipped the National Elevation Dataset for Oklahoma agreggated it to a 1 arc-minute resolution, so she sends you a link to download it. Download it into your data folder and import it into R using the raster function. Plot the resulting data layer.