Data Science for Agriculture
How to manage and manipulate data for agricultural research

This is a follow-up to R Markdown Figures.
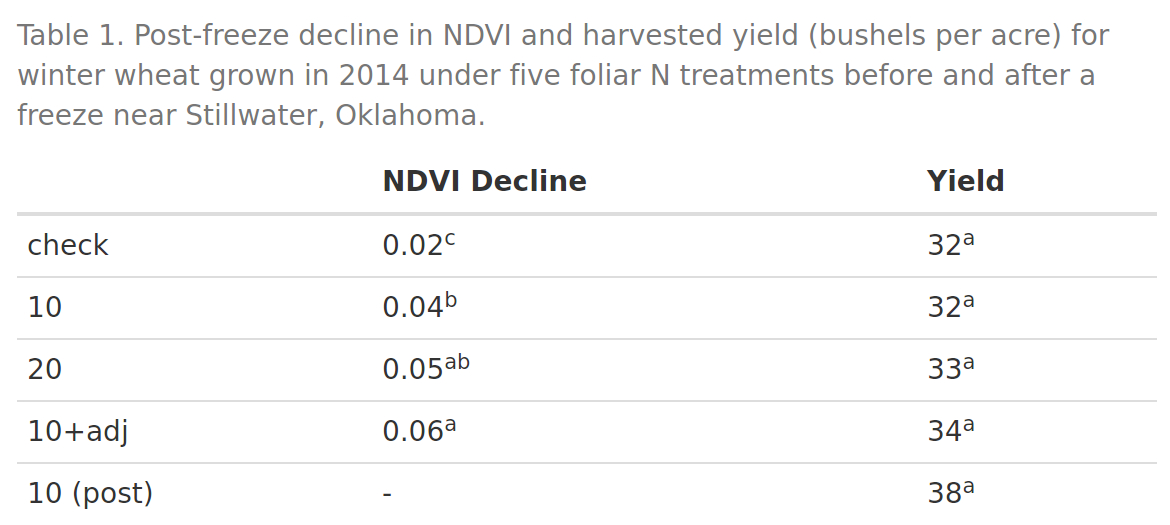
Because you are unsure how Dr. Raun will prefer the data to be presented, you decide to include the data in a table, as well.
Within a new code chunk named “results_table”, create a data frame that has
columns with treatment means for post-freeze NDVI decline and yield. Set the
column names to “NDVI Decline” and “Yield”. Set the row names to abbreviations
for the corresponding treatments (i.e. not just treatment number). (Hint:
I suggest you round the values appropriately and then convert these to text
using paste(). You also will need to add a dash in your NDVI column for the
missing treatment level)
Add the statistical significance labels to your results table using the
paste0() function.
Modify your code to add Markdown notation to make the significance labels superscript.
Use the kable() function to generate your table.
Use the caption argument to the kable() function to add a suitable
caption for the results table.
Set the code chunk options so that your R code is not displayed.