
Learning Objectives
Following this assignment students should be able to:
- download public data using R packages
- combine data from multiple public data sources
- integrate public data with their own data
- use public data to enhance analysis of their own data
Reading
-
Topics
- R tools for Accessing publicly-available data
- Strategies for combining sptaial and tabular data
-
Readings
Exercises
-- Using FedData --
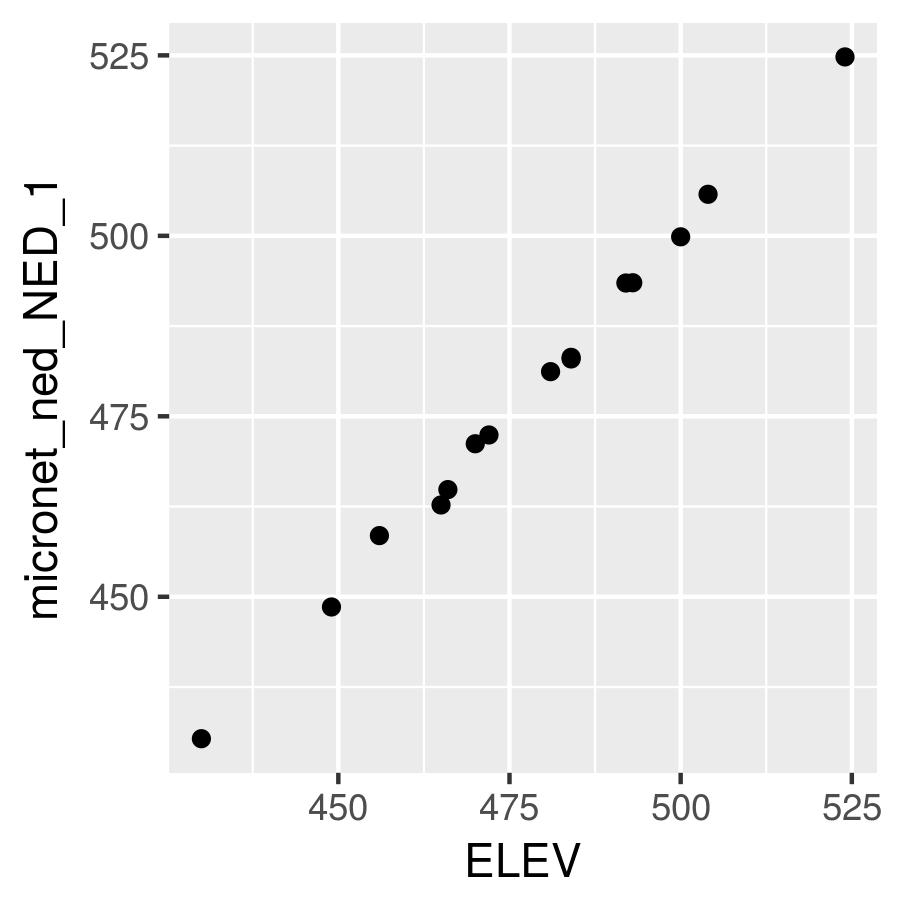
Your advisor wants to conduct an analysis using weather data from the USDA ARS Micronet installed within the experimental watershed near Fort Cobb, OK. She gives you a link to a shapefile that contains metadata for each of the stations. She wants you to check the elevation data in the shapefile against the National Elevation Dataset (NED) created and maintained by the USGS.
-
Install the
FedDatapackage and read in the shapefile for the Fort Cobb Micronet. -
Use the Fort Cobb Micronet layer with the
get_ned()function from theFedDatapackage to download the NED data for your area of interest. -
Use the
extract()function from therasterpackage to extract the NED values for each point in the Fort Cobb Micronet layer. (Hint: Use thespargument to return a SpatialPointsDataFrame.) -
Use
ggplot()to create a scatter plot with elevation from the Micronet layer on the y-axis and elevation from the NED on the x-axis. Set your axis labels appropriately.
-
-- SSURGO data with soilDB --
Your advisor is pleased with the results so far and asks you to compile some soils data for each of the stations. You decide to check for an R package that will help you and find the
soilDBpackage. You read in the documentation that the package provides functions to query the NRCS Soil Data Access web service for SSURGO soil data. This sounds like the perfect tool for your project.-
Install the
soilDBpackage. Use the Fort Cobb Micronet layer with theSDA_query_features()function from thesoilDBpackage to download soil mapping unit information for each station. Merge the resulting data frame with your existing SpatialPointsDataFrame. - Your new SpatialPointsDataFrame, although interesting, does not give you all the information you need. Your advisor wants you to find drainage class and surface sand percentage for each station. Through reading the package documentation, you discover that in order get this information you will need to use an SQL query with the
SDA_query()function. You find an example query that does part of what you want:mukeys <- c(381911,381889); qry <- paste0("SELECT mukey, cokey, comppct_r, drainagecl FROM component WHERE mukey IN (", paste(mukeys,collapse=","), ")"); soil.data <- SDA_query(qry)Modify the code so that the query returns information for only the mapping unit keys (
mukey) for each of the Micronet stations. -
You notice that the above code returns multiple values for each mukey. That is, there are multiple soil types (
components) for each mapping unit. Usefilter()to keep only the soil components (cokeys) within eachmukeythat have the largest coverage within the mapping unit (i.e. wherecomppct_ris greatest). Merge this data frame with your Micronet SpatialPointsDataFrame. -
These results are good, but they do not yet contain the surface sand percentage. After some reading you determine that the sand percentage is contained in the variable
sandtotal_rin thechorizon. Copy and modify the code for your previous query so that you select thecokey,hzdept_randsandtotal_rfrom thechorizontable where the cokey is in the filtered list of cokeys from the prevous problem. -
This is almost what you need except that you now have multiple horizons for each soil type. Filter the output to only include the surface sand percentage for each soil type (i.e. where the horizon depth
hzdept_ris least). - Merge the resulting data frame with the Micronet SpatialPointsDataFrame.
-